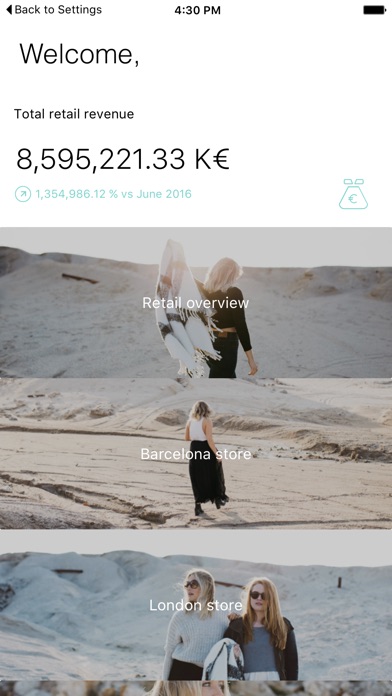
An exceptional mobile dashboard that reinvents reporting
Your company at your fingertips
ItÍs now over with illegible report overload in your email box or data that is complex to collect. Your dashboard is delivering the information you need to understand whatÍs going on in your business and make good decisions.
A new experience in operational management
You have real time data, easily accessible and always at your disposal to help you manage your business.
Save time and increase efficiency
You will quickly feel at ease with your dashboards, like with an iPhone. It will help you extract, with your expertise, the facts for relevant information.
Happy and engaged employees
Being happy and engaged at work needs understanding of its activity and pleasure to use beautiful dashboards. Your inspired and engaged team will then go the extra mile.
Regain Power
You will be able to work in total autonomy without the support of your IT department. You will build and spread your dashboards by your own.
- Company Name:Captain Dash
(View Trends)
-
Headquarters: (View Map)Paris, France
-
Information Technology and Services
-
50 - 200 employees
- 23098236 Global Rank
- 1652125 Saudi Arabia
-
Direct100.00%
-
Display0.00%
-
Mail0.00%
-
Referrals0.00%
-
Search0.00%
-
Social0.00%

- United States 20.3%
- India 16.7%
- Australia 6.2%
- Pakistan 2.8%
- Philippines 2.5%
- Opportunities
- Partners Programs
- Amazon Associates Program
- 10 SDKs
- 4.06 Avg. Rating
- 12 Total reviews

- App Url: https://itunes.apple.com/app/captain-dash-1/id606988095
- App Support: http://www.captaindash.com
- Genre: Business
- Bundle ID: com.captaindash.captaindash
- App Size: 11.4 M
- Version: 6.0.16
- Release Date: April 8th, 2013
- Update Date: September 16th, 2020
Description:
The Dashboard is an application that reinvents the reporting. Friendly, elegant and easy to use, it provides access to your data and indicators you need on the move.
You spend less time collecting data and more in strategizing and finding new insights.
You transform your 50 weekly boring reports into an impactful and interactive app on your iPhone, iPad or Web desktop.
• Collect & synchronize your data
You can easily sync all the data you need to understand your business. Collect, aggregate your data, from your social networks to your legacy system, from your Excel files to your APIs.
• Choose indicators to suit your needs
You have the freedom to build your own performance indicators that are calculated by our robots in real time from different data sources.
• Leverage gorgeous visualizations to understand your data
You can transform your Excel spreadsheets into a beautiful and impactful data visualizations and discover new areas of analysis and understand your data.
• Share and collaborate
You can easily share information with your team by sharing charts and data set or leaving a note on each chart.


Sort by
Paktuaqww
CM_NYC
Does not connect
keyfob
Fantastic
Ocularopoeia
Omg
Bregrin
Social Media Measuring Made Fun
Magic App
-
Native0%
-
Standard0%


Cant connect